Blackboard Analytics for Learn combines extensive data from Blackboard with student and course attributes from our student information system (SIS) and enterprise resource planning (ERP) to create comprehensive reports and dashboards for our students, instructors, staff, and leadership. Instructors also have reports within each Blackboard course.
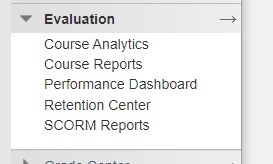
Located with each instructor’s course, are five instructor specific reports. The Learning Analytics is located in the Evaluation area of the course. Under the Course Management are of the course menu, select Evaluation. This will open the Evaluation menu. From this menu, select Course Analytics.

There are four reports from which to chose. The final report, Student Comparison Average is revealed when clicking a student’s name in one of the other reports, These reports are: (Click an item to download a sample.)
- Course-At-A-Glance
- Course Activity and Grade Scatter Plot
- Activity and Grade Matrix
- Course Submission Summary
- Student Comparison Average
The Course At a Glance compares the your that your are currently logged into against other course in the same department.
Activity and Grade Scatter Plot plots the distribution of student activity against their grades in this course.
The Activity and Grade Matrix shows a visual representation of student activity in the course.
The Course Submission Summary shows a summary of user submissions for the course.
The Student Comparison Average report shows an individual student’s activity compared to other students in the class. This is the only report that students can view. It is available to instructors by clicking an individuals’ name one of the other reports.
